


Highlights
Balance Sheet
- Bank’s Balance Sheet size crosses Rs. 50 lakh crores.
- Credit growth at 14.93% YoY. Domestic Advances grew at 13.66% YoY and Foreign Offices’ Advances grew by 22.39% YoY.
- Domestic Advances growth driven by Retail Personal Advances (18.58% YoY), out of which Home Loan grew by 13.77% YoY.
- Corporate Loan book grew by 10.57%; SME and Agri loans have also registered YoY growth of 10.01% and 9.82% respectively.
- Whole Bank Deposits grew at 8.73% YoY, out of which CASA Deposit grew by 6.54% YoY. CASA ratio stands at 45.33% as on 30th June 22.
Profitability
- Operating Profit for Q1FY23 at Rs. 12,753 crores as against Rs. 18,975 crores in Q1FY22, impacted by MTM Losses on investment book.
- Net Profit for Q1FY23 at Rs. 6,068 crores as against Rs. 6,504 crores in Q1FY22.
- The MTM hit also had an adverse impact on bank’s ROA and ROE, which stand at 0.48% and 10.09% respectively.
- Excluding Trading Income and MTM, Core Operating Profit increased by 14.39% YoY, from Rs. 16,873 crores in Q1FY22 to Rs. 19,302 crores in Q1FY23.
- Net Interest Income (NII) for Q1FY23 increased by 12.87% YoY.
- Domestic NIM for Q1FY23 increased by 8 bps YoY to 3.23%.
Asset Quality
- Gross NPA ratio down by 141 bps YoY at 3.91%, while Net NPA ratio down by 77 bps YoY at 1.00%.
- Provision Coverage Ratio (PCR) improved by 719 bps YoY at 75.05%. PCR (Incl. AUCA) stands at 90.14%.
- Slippage Ratio for Q1FY23 stands at 1.38%; improved by 109 bps YoY.
- Credit Cost for Q1FY23 stands at 0.61%; improved by 18 bps YoY.
Capital Adequacy
- Capital Adequacy Ratio (CAR) as at the end of Q1FY23 stands at 13.43%.
Alternate Channels
- 65% of SB accounts and 38% of retail asset accounts acquired digitally through YONO.
- Share of Alternate Channels in total transactions increased from 95.1% in Q1FY22 to 96.6% in Q1FY23.
Key Summary of Q1FY23 Results
| Rs in Crores | Q1FY22 | Q4FY22 | Q1FY23 | YoY % | QoQ % |
| Profit & Loss | |||||
| Interest Income | 65,564 | 70,733 | 72,676 | 10.85 | 2.75 |
| Interest Expenses | 37,926 | 39,535 | 41,480 | 9.37 | 4.92 |
| Net Interest Income | 27,638 | 31,198 | 31,196 | 12.87 | -0.01 |
| NIM, % (Domestic) | 3.15 | 3.40 | 3.23 | 8 bps | -17 bps |
| Operating Profit | 18,975 | 19,717 | 12,753 | -32.79 | -35.32 |
| Loan loss provisions | 5,030 | 3,262 | 4,268 | -15.14 | 30.86 |
| Profit after tax | 6,504 | 9,114 | 6,068 | -6.70 | -33.42 |
| Rs in Crores | Jun 21 | Mar 22 | Jun 22 | YoY % | QoQ % |
| Balance Sheet | |||||
| Gross advances | 25,23,793 | 28,18,671 | 29,00,636 | 14.93 | 2.91 |
| Domestic Corporate | 7,90,494 | 8,70,712 | 8,74,014 | 10.57 | 0.38 |
| Domestic Retail Personal | 8,72,104 | 10,02,303 | 10,34,111 | 18.58 | 3.17 |
| Of which: Home loans | 5,05,473 | 5,61,651 | 5,75,075 | 13.77 | 2.39 |
| Deposits | 37,20,987 | 40,51,534 | 40,45,696 | 8.73 | -0.14 |
| Domestic CASA | 16,59,234 | 17,75,084 | 17,67,666 | 6.54 | -0.42 |
| Domestic Term Deposits | 19,50,107 | 21,45,117 | 21,32,185 | 9.34 | -0.60 |
| CASA Ratio (%) | 45.97 | 45.28 | 45.33 | -64 bps | 5 bps |
| GNPA | 1,34,259 | 1,12,023 | 1,13,272 | -15.63 | 1.11 |
| NNPA | 43,153 | 27,966 | 28,258 | -34.52 | 1.04 |
| Ratios, % | Q1FY22 | Q4FY22 | Q1FY23 | YoY, bps | QoQ, bps |
| Asset Quality | |||||
| GNPA | 5.32 | 3.97 | 3.91 | -141 | -6 |
| NNPA | 1.77 | 1.02 | 1.00 | -77 | -2 |
| PCR (Incl AUCA) | 85.93 | 90.20 | 90.14 | 421 | -6 |
| PCR | 67.86 | 75.04 | 75.05 | 719 | 1 |
| Slippage Ratio | 2.47 | 0.43 | 1.38 | -109 | 95 |
| Credit Cost | 0.79 | 0.49 | 0.61 | -18 | 12 |
| Capital Ratios | |||||
| CET-1 ratio | 9.91 | 9.94 | 9.72 | -19 | -22 |
| Tier-1 ratio | 11.32 | 11.42 | 11.15 | -17 | -27 |
| CAR | 13.66 | 13.83 | 13.43 | -23 | -40 |


More Stories
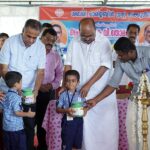
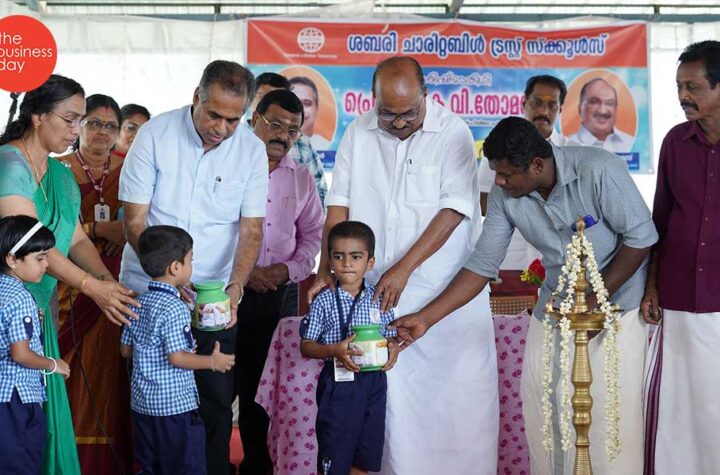
7300 students of 6 schools in Palakkad district get piggy banks with a Rs.100 bill inside each
Prof. K V Thomas Vidhyadhanam Trust teams up with Kalpesh Kinariwala’s Pantheon Development to give away scholarships to 500 Kerala students
Aishwarya Subramanian – How this young woman designs her life as a Production Designer